What would you be most excited to see in the next set of TypeScript release notes? Perhaps a fancy new language feature that makes generic types more powerful? A new way to do type inference? Or maybe a new refactor in the language service?
Now would you rather have that shiny new feature, or would you rather have TypeScript build your code 20% faster? In terms of your daily happiness and productivity, the speedup will almost certainly be the bigger win.
TypeScript performance is an important and sometimes frustrating part of the developer experience. Projects tend to start small and fast, but as they grow, type checking (tsc) and editor interactions (tsserver) get slower and TypeScript becomes less of a joy to use.
How can you make TypeScript run faster? Microsoft has a guide to TypeScript performance, and that's a great place to start. This post will talk about one particularly easy and effective way to debug performance issues: looking at what TypeScript is compiling using a treemap visualization.
Before we get started, let's be clear what we mean by performance. This is not the runtime performance of your code. For the most part, TypeScript is compiled to JavaScript by stripping out all the type annotations. So it cannot affect the runtime performance of your code. (If you see claims that TS affects runtime performance, for example this notoriously shoddy paper, be very skeptical!) When I say "performance", I mean compiler performance and language service performance: How long does it take tsc to compile your code and report type errors? And how long does it take after you edit a source file for errors to appear and disapper in your editor? These affect developer experience (DX) directly, but not user experience (UX).
One of the best ways to be fast is to do less stuff. In the case of TypeScript, that means compiling fewer lines of code.
The tsc command has a handy --listFiles option that will show you exactly what it's looking at when it compiles your code:
|
If TypeScript has gotten sluggish on your project, then you should look at this list! There might be source files that surprise you.
For a large project, this list can include thousands of source files, so you'll want some way to visualize it. My preferred approach is a treemap, which you can quickly generate using the webtreemap-cli package. Since tsc will spend more time on a large file than a small file, we'll want to visualize the number of bytes in each file being compiled.
Here's the magic incantation (see here for the "stat" syntax):
# macOS / BSD
tsc --noEmit --listFiles | xargs stat -f "%z %N" | npx webtreemap-cli

# Linux:
tsc --noEmit --listFiles | xargs stat -c "%s %n" | npx webtreemap-cli
For my project, here's what that looks like:
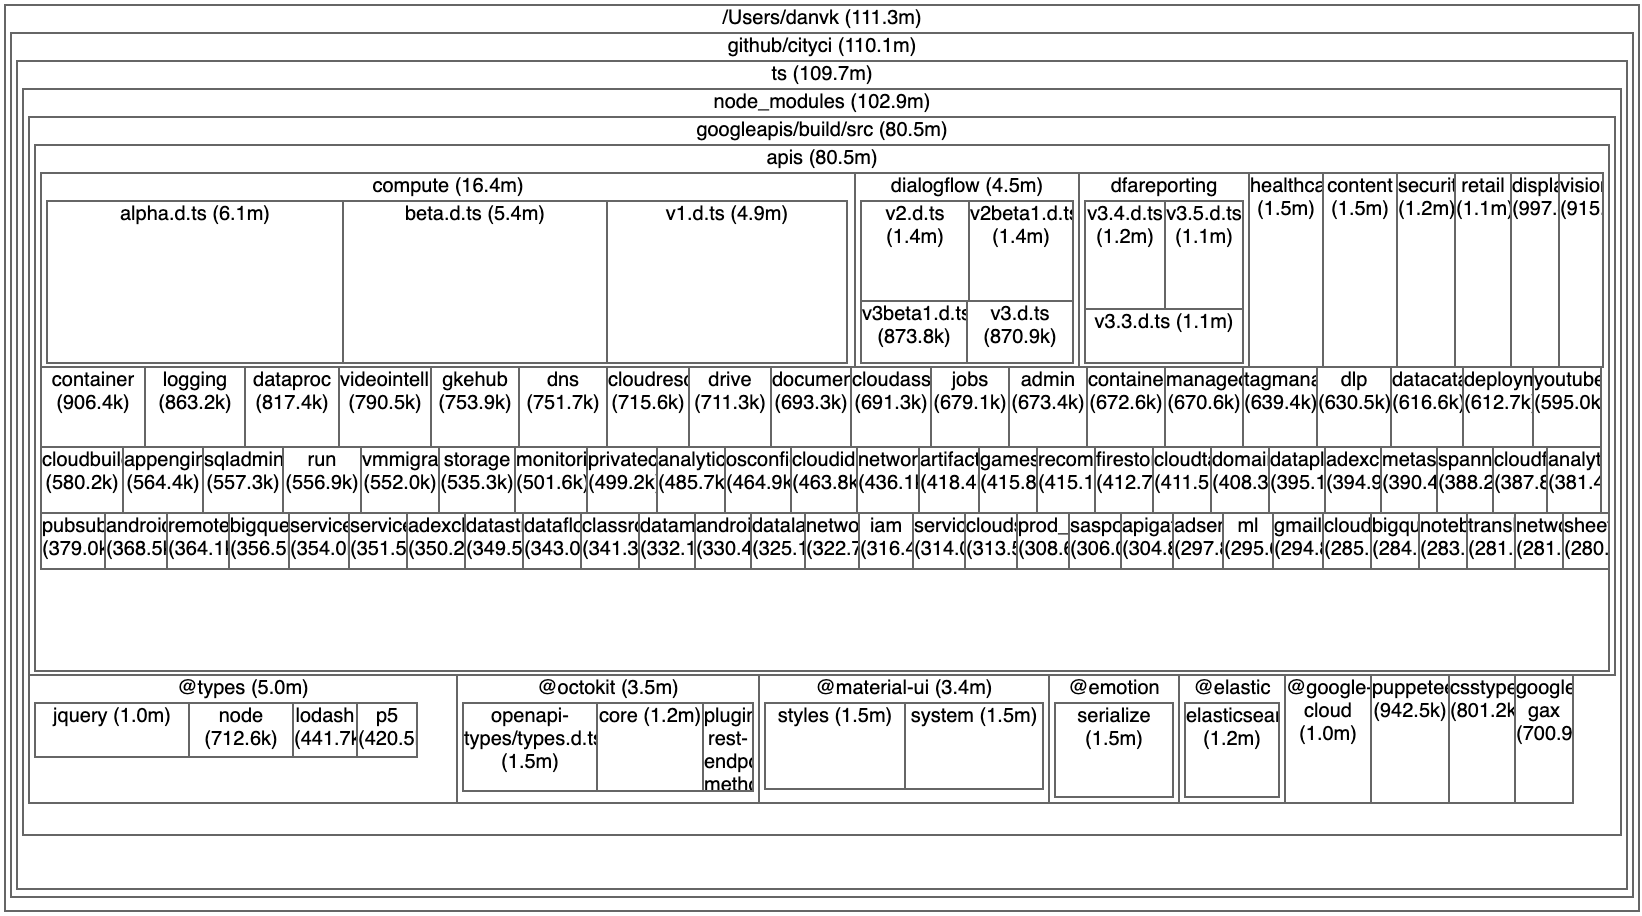
First off: that's a lot of code! Over 111 megabytes. With that much source to churn through, it's no wonder TypeScript has gotten sluggish.
Second: my project is mostly googleapis? That's surprising. We do use the Google Cloud Storage API and the Google Sheets API, but that's it. And yet tsc reports that it's pulling in 80+ MB of Google APIs, including multiple versions of APIs that I never use (e.g. compute alpha, beta, v1).
This is exactly the sort of insight that treemaps are good at producing! Before I saw that visualization, I hadn't thought much about my project's usage of googleapis. Now I can't think about anything else!
The root issue here is that Google distributes all 300+ of its APIs as a single npm package. This has been a long-standing issue with Google's Node.js APIs. Fortunately for us, the issue was recently fixed! Google now publishes individual packages for each API. Instead of depending on all of googleapis, you can now depend on just @googleapis/sheets.
After this change, the treemap for my project looks substantially different:
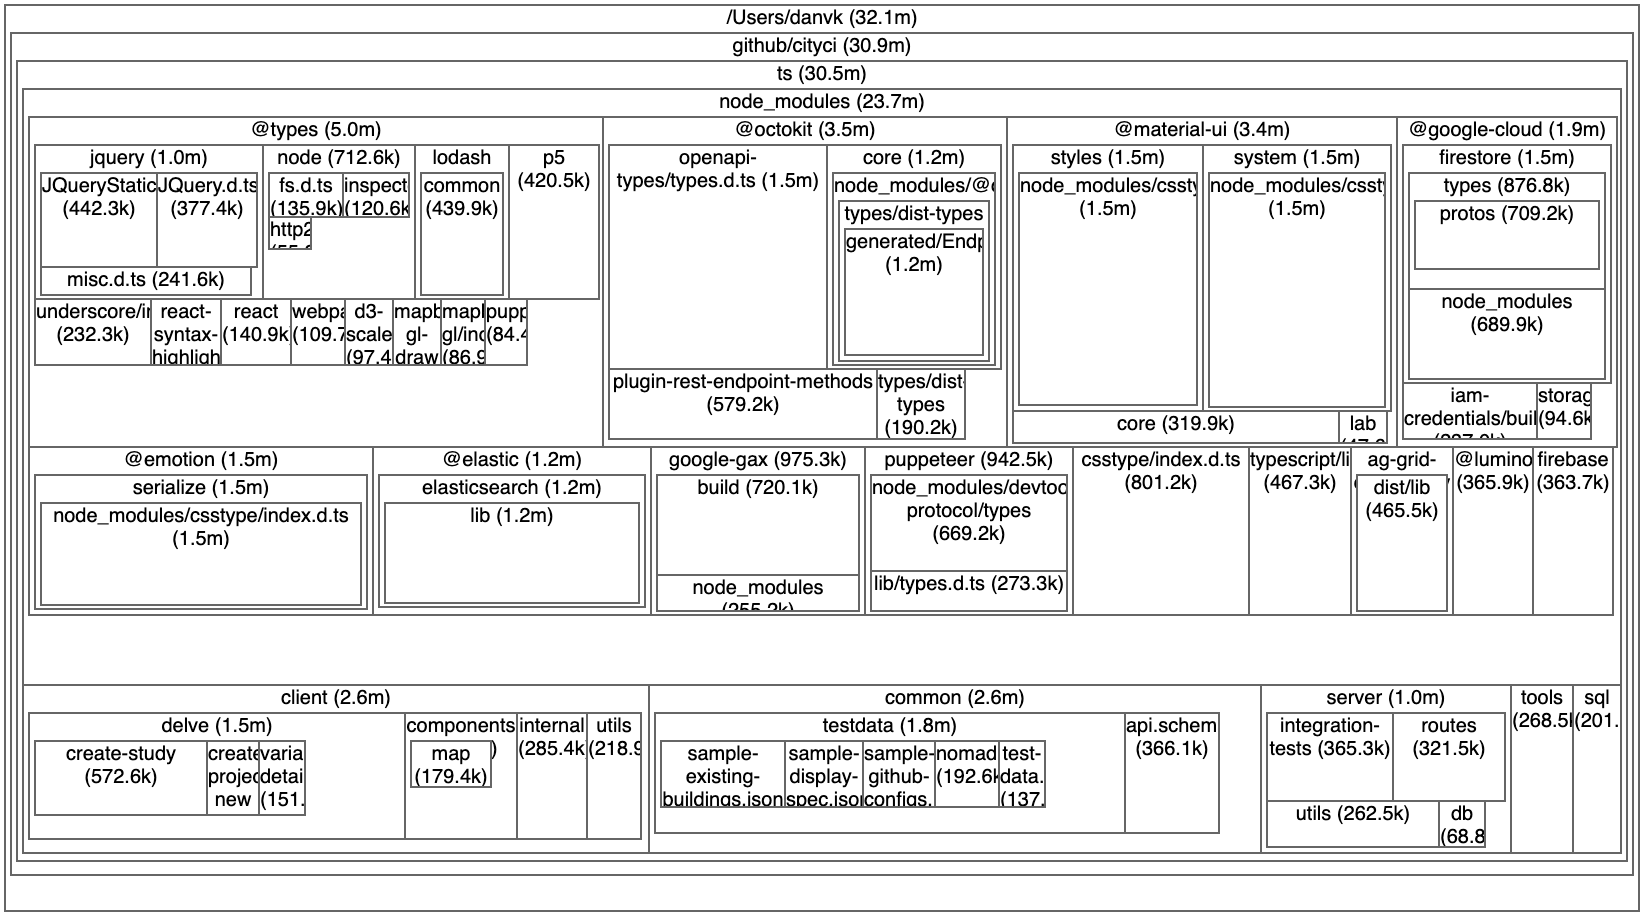
The most important change is the top-line number: there's 80MB (70%) less source code for tsc to churn through. It's interesting to note that many of the large blocks that remain (@octokit, csstype, firestore) have the same problem as googleapis, if less egregiously so: they ship a single giant source file containing every API you could ever depend on.
Now for the big question… did this make my build faster? At least in this case, the answer is a clear "yes". I ran:
time tsc --noEmit --incremental=falsefive times before and after my change. The average time went from 35.7s → 28.9s, a 20% speedup. Not bad! And while it's harder to measure language service (tsserver) performance, one hopes that this change will help there, too. It's notable that the 20% speedup doesn't match the 70% reduction in source code. Just reading all those unused type declarations doesn't take as much time as type checking the code that is used. Still, this is a nice win.
Try running the magic command to visualize your TypeScript code as a treemap. You might be surprised what's making it into your build!
tsc --noEmit --listFiles | xargs stat -f "%z %N" | npx webtreemap-cliIn a future post, we'll look at strategies for reducing how much code you have to import, both as a library author and a consumer.